kuniga.me > NP-Incompleteness > Browser Performance
Browser Performance
28 Mar 2020
In this post we’ll go over the topic of browser performance. We’ll cover tools and techniques to identify, measure and improve performance on the client side of web applications.
Assumptions. Our tests use the Chrome browser, which means the tools likely only make sense for this specific browser (general techniques are agnostic). All the screenshots are taken either on a Linux machine running Gnome or the latest MacOS, though it should be relatively similar to Chrome in other platforms. The Chrome version used is v80.
Setup. I’ll be using simple standalone HTML/JavaScript code. I recommend downloading the folder browser-performance.
Analyzing Performance
FPS Meter
This widget tracks the number of frames per second. To enable it,
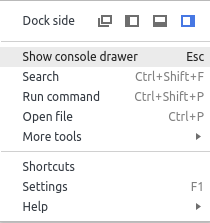
In the … icon menu, click on Show console drawer:
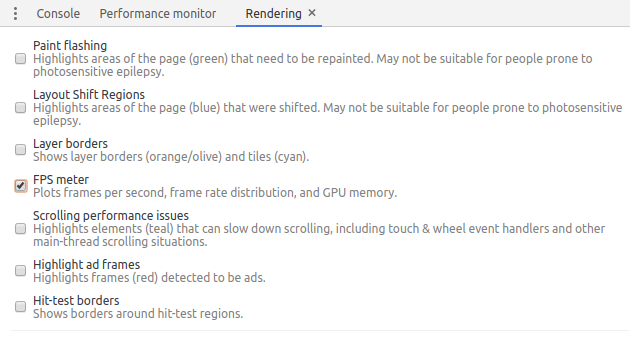
In the Rendering tab, check the box FPS meter:
And it should looks like this:
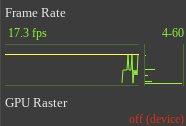
The yellow bar represents 60 FPS, which is the threshold under which the page might look sluggish. The bar chart on the right is a histogram view of the visible line chart. The bars at the bottom represent low FPS and on the top high FPS. The number on the top are the range (max/min FPS).
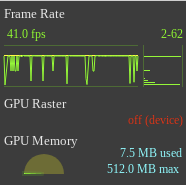
Initially the numbers will be low because the is not previous data, since it only measure FPS when the page re-renders. To prime the data you need to manually trigger many visual updates, say resizing the window or specific actions on your application:
Flame Chart
The flame chart is a very useful visualization to understand performance. It allows identifying expensive functions at a glance (long bars) and dive in into sub-functions quickly.
To use this, download and open (locally) the on_click.html example. Click on the “Performance” tab. Click the record button. Click the “Click Me” button on the page. After some number is displayed, click on Stop on the recording. We should get a chart similar to the one below:
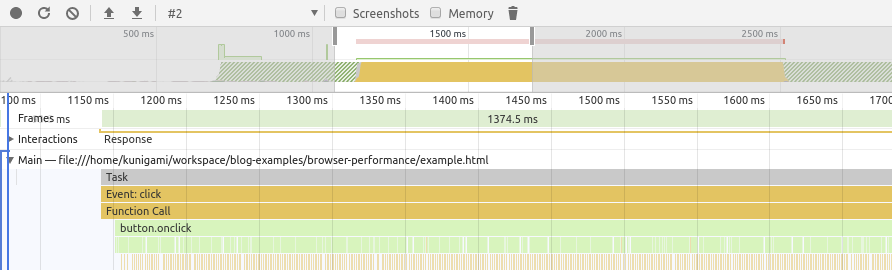
We can see the area chart at the top which is an overview of the processing happening below. The y-axis in that chart is amount of CPU.
The second chart is the flame chart. It has the bars corresponding to function calls (e.g. Event:click) and below that are the functions that were called. We see a generic Function Call because we used a anonymous arrow function like below:
button.onclick = () => {
expensive();
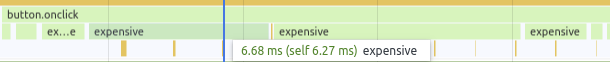
}Another thing to notice is that if we zoom enough, we see what looks like multiple calls of the expensive() function but in our code it is a single continuous function. I’m not sure why Chrome does that, but I’m assuming it has to do with the garbage collection kicking in.
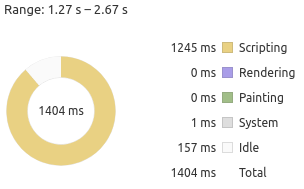
There are other interesting alternative views at the bottom. The doughnut chart gives a breakdown on types of work being done. In our case it’s just a mix of scripting and idle:
The Call Tree view is great for the details. It allows looking at specific call chains and how much each is contributing. In our example, we can see Event: click is an expensive operation but it’s the expensive() function that is the culprit (based on the Self time):
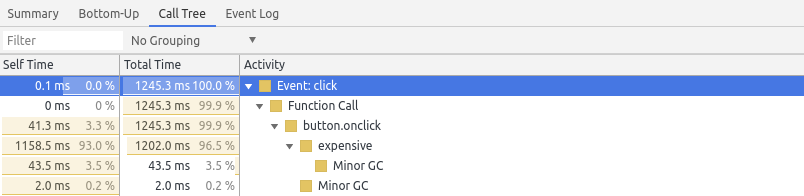
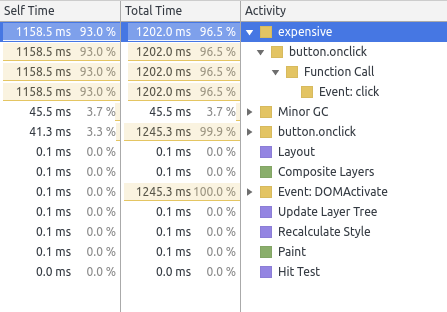
To find specific bottlenecks the Bottom-Up view might be more interesting. If the Call Tree shows a nested tree from the root, the Bottom-up view shows the internal nodes but sorted by Self Time:
Performance Metrics
When we record a trace that includes a page load, it also includes some standard metrics like First contentful paint (FCP). The definition of some them are here [4].

It’s possible to write our own events that show up in Timings. We just need to add markers and measure duration using the performance API [6]:
    performance.mark('expensive-start');
    expensive();
    performance.mark('expensive-end');
    const value = performance.measure(
        'expensive-mark',
        'expensive-start',
        'expensive-end',
    );
Then it shows up in the Timeline row:

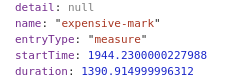
The result of performance.measure() contains useful information:
Network
When we first open the Network tab, it immediately starts recording the network activity, but since we want a full-scan of the page requests, let’s stop it, clear the data, start recording again, reload the page and then stop recording to get a report.
The sample below is from imdb.com:
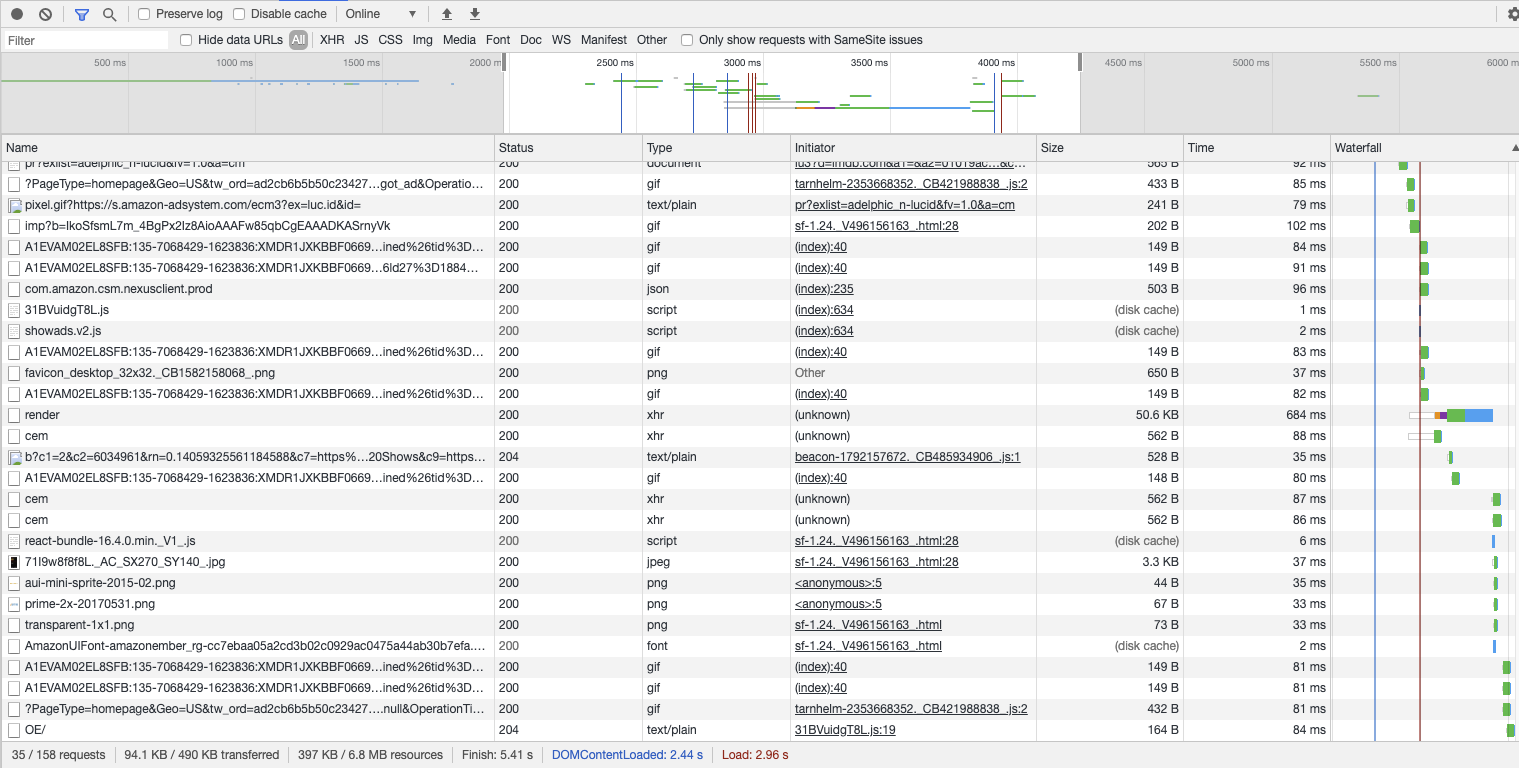
Similar to the performance tab, this view provides a timeline which we can zoom in. The table below lists all network requests performed by the browser, including static resources like images, JavaScript files and async requests to fetch more data.
We can filter by request type at the top:

Here we could look for oversized images (though unlikely you’ll need to show a gigantic high-resolution image by default - so look into sending a thumbnail with a link to the larger image) or slow async requests.
Async requests are of type XHR (XmlHttpRequest), so we can filter by that:

the bars on the last column give an indication of not only the time a request took, but the dependencies. Sometimes an async request doesn’t start until a specific one finishes. If we hover over the bar of the render request, we see:
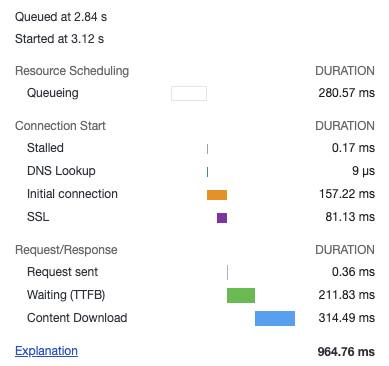
It has a nice breakdown on the timings, including DNS lookup and SSL latency (authentication). It also includes queuing time, the amount of time waiting TTFB, and then the content download.
The queuing indicates that the request was ready to go, but needed to wait on some other dependency or due to browser limits. Usually there’s a limit of active XHRs per domain the browser can have (<10) [7].
TTFB means “Time to first byte” - this means that the time it takes to start receiving data. This is indicative of the time the server took processing.
Content download is the time spend getting the resource/data. It’s correlated with the size of the data, network bandwidth/speed.
Measuring Performance
Duration from start
The performance API keeps track of specific events in the page loading lifetime, so we can measure durations compared to a specific point in time.
performance.now() [9] provides the timestamp since the page started to load (in rough terms - see this more precise definition).
Side note: browsers purposefully reduce the precision of these APIs to protect against attacks that rely on high-precision timing information [10].
Custom Durations
As we mentioned in an earlier in measurement.js, we can measure durations. By using performance.mark() and performance.measure() [5].
Benchmarking
We can use the APIs above to create simple benchmarks.
Before we start: always beware of over-optimizing code! You might end up spending a lot of time to improve performance against a specific benchmark, browser or even JavaScript engine version. That’s part of the reason V8 retired the benchmark tool Octane.
That said, if you identify some code in the critical path that executes the same operation on the order of millions of times, it might be worth optimizing it. One example is changing from array methods like forEach() and reduce() to pure for-loops. We can perform several runs of the same function and get the average. I opted for using a random number generator to avoid any optimization related to caching.
The function generated an array with 10 million random floats and calculates the sum. It then runs the code 10 times. The results follow:
- for loop 12ms
- reduce 156ms
- forEach: 208ms On Firefox it yields
- for loop 40ms
- reduce 48ms
- forEach 64ms We can see a for loop is ~92% and ~16% faster than reduce on Chrome and Firefox respectively. Some takeaways:
- It’s highly browser-dependent! Don’t over-optimize code for one browser.
- Although the relative gains are substantial, the absolute improvements are only 100ms for an array of 10 million items - how practical is this? The creation and allocation of the array probably takes more time than this.
- This is pure computation, so no DOM access is needed, so consider using Web Workers
Techniques
Here we discuss some techniques to improve performance. The first two are general purpose optimizations but we include here for completeness.
Reduce Algorithmic Complexity
We’ll start with a quote from Donald Knuth [15]:
Programmers waste enormous amounts of time thinking about, or worrying about, the speed of noncritical parts of their programs, and these attempts at efficiency actually have a strong negative impact when debugging and maintenance are considered. We should forget about small efficiencies, say about 97% of the time: premature optimization is the root of all evil. Yet we should not pass up our opportunities in that critical 3%. Before optimizing code, we should consider optimizing algorithm. This means reducing the big-O complexity. In a recent project, we found several wins by identifying hidden O(n^2) code and converted them to O(n).
Trade Memory for Computation
We often need to make this tradeoff: to improve speed of code (computation) we have to use more memory. This is actually how we improved the O(n^2) to O(n): by keeping a look-up hash table for fast access.
In JavaScript a quick look-up table can be implemented via Object, or ES6 Map and Set. Other techniques involve caching (memoization).
Encode JSON Payloads
In [8] Addy Osmani and Mathias Bynens suggest that if you’re sending large JSON payload via the network, it’s better to send them JSON-encoded instead of JavaScript objects literals:
Because the JSON grammar is much simpler than JavaScript’s grammar, JSON can be parsed more efficiently than JavaScript
Reduce CSS selector complexity
In [17], Lewis suggests reducing the complexity of CSS selectors such as
.box:nth-last-child(-n+1) .title {
  /* styles */
}
to
.final-box-title {
  /* styles */
}
The reason being:
Roughly 50% of the time used to calculate the computed style for an element is used to match selectors (…)
Use Flexbox
In [18] Lewis suggests that flexbox is more efficient than other layouting alternatives such as float positioning. One caveat made in the article is that is node widely supported. As of 2020 however, that doesn’t seem the case anymore.
Avoid reading DOM properties right after mutating them
In [18] Lewis explains that the Layout phase happens after the JavaScript runs:

This means that changing a DOM property and reading it afterwards, requires the browser to block and perform the layout before reading the new value. If possible, make the read before the write.
Avoid some advanced CSS effects
This is more of a tradeoff between performance and design. In [19] Lewis mentions that properties such as box-shadow can be expensive.
It’s unclear however which specific CSS properties are expensive.
Use Layers (but sparingly)
In [19] Lewis suggests creating layers for elements that are updated very often, to avoid these updates from causing updates in the rest of the page. One way to force the creation of a layer is:
.moving-element {
  will-change: transform;
}
These should only be created if there’re clear improvements in performance, since like indexes in databases, they come with memory and management cost.
Use requestAnimationFrame()
Since JavaScript’s main thread is used for rendering, running expensive function might cause the UI to freeze. In order to prioritize the rendering, we can schedule expensive functions to run we can use requestAnimationFrame(). According to [3]:
When visual changes are happening on screen you want to do your work at the right time for the browser, which is right at the start of the frame. The only way to guarantee that your JavaScript will run at the start of a frame is to use requestAnimationFrame In [20], Lewis provides a more specific case for the use of
requestAnimationFrame(): on scroll input handlers since they block the UI.
There’s one caveat however: Input handlers execute before requestAnimationFrame(), so if it makes style changes and then we read it in requestAnimationFrame, we run into the problem described in Avoid reading DOM properties right after mutating them.
Web Workers
As we discussed previously, web workers run in a separate thread, which prevents your application from freezing because the main thread is blocked. To understand why this happens, it’s important to know the basics of how the JavaScript execution model works.
The major caveat is that web workers don’t have access to the DOM but they do have I/O access (like XHR).
Web Assembly
It’s possible to use lower level languages like C++ and Rust and run them on the browser by compiling them to an intermediate representation called Web Assembly (WASM).
This guide explains how to compile Rust code to Web Assembly, package it as an npm package and execute it on the browser via Webpack. I’ve tried myself and the process is relatively straightforward.
Portability. Web Assembly’s official website [14] claims it is portable across different platforms.
Existing libraries. One of the major selling points of Web Assembly is being able to run existing libraries written in languages like C/C++. In [11] PSPDFKit’s team showcase their port of a PDF renderer that previously had to be done on the server and now can be done by shipping the binary as wasm. They perform some benchmark, getting mixed results in terms of performance but had several follow-up with browser vendors and were able to improve their performance (though no subsequent analysis was available in the post).
Web Assembly’s website [13] lists other use cases.
Performance. The main benefit I can see for starting a project from scratch in say, C++ or Rust, would be performance over JavaScript. JS vs WASM’s site [12] provides a set of computations in JavaScript and wasm compiled from C++. The results are not promising: in most cases Javascript is faster.
GPU via WebGL
WebGL (Web Graphics Library) is a JavaScript library available in most browsers, with the main purpose of rendering 2D and 3D graphics. But because it has access to the GPU (JavaScript doesn’t have direct access), it’s can be used for heavy but highly parallelizable computations such as Machine Learning [16].
If your application requires this sort of processing, WebGL can be an interesting idea.
Conclusion
This was another of the notes on Web Development. The other notes are listed in the Related Posts section below.
In this post we covered a wide variety of tools and techniques regarding performance of client-side applications. We didn’t delve into much detail, but hopefully some of the links will serve as starting pointers for further research.
For me it was particularly interesting to learn more about Web Assembly and I’m interested in studying it further, especially with Rust.
References
- [1] Get Started With Analyzing Runtime Performance
- [2] Rendering Performance
- [3] Optimize JavaScript Execution
- [4] User-centric performance metrics
- [5] User Timing API
- [6] StackOverflow: Using performance.mark() with Chrome dev tools performance tab
- [7] StackOverflow: How many concurrent AJAX (XmlHttpRequest) requests are allowed in popular browsers?
- [8] The cost of parsing JSON
- [9] MDN: performance.now()
- [10] Github w3c/hr-time: Reducing the precision of the DOMHighResTimeStamp resolution
- [11] A Real-World WebAssembly Benchmark
- [12] JS vs WASM
- [13] WebAssembly: Use Cases
- [14] WebAssembly: Portability
- [15] Donald Knuth: Structured Programming with go to Statements
- [16] TensorFlow.js: Machine Learning for the Web and Beyond
- [17] Reduce the Scope and Complexity of Style Calculations
- [18] Avoid Large, Complex Layouts and Layout Thrashing
- [19] Simplify Paint Complexity and Reduce Paint Areas
- [20] Debounce Your Input Handlers
Related Posts
- Notes on JavaScript Interpreters - This post focuses on the detail of Chrome’s V8 interpreter. The relationship with performance is that understanding how JavaScript code is executed (e.g. event loop model, JIT) can give us insight on how to optimize it.
- Web workers - is a browser feature that allows running code outside of the main thread. This can speed up computation as long as no DOM access is needed.
- Notes on how browsers work - provides a basic overview on the stages of executing a web page, from downloading HTML and Javascript, executing the scripts, constructing the DOM tree and laying out the page. Understanding these steps might give insights on how to better optimize the app.
- Notes on Javascript Memory Profiling in Google Chrome - memory is related to performance because memory and CPU are the major bounded resources your app has to deal with. Not taking care of memory (e.g. memory leaks) could also exhaust the memory available for the execution engine to make the CPU-Memory tradeoffs we mentioned above.
