kuniga.me > NP-Incompleteness > A Collage Maker In Python
A Collage Maker In Python
24 Jan 2023
Every new year I post a retrospective of the previous year and one of my favorite parts is sharing photos taken on trips.
To avoid creating a wall of individual photos, I prefer grouping them into a collage and then adding links to the larger photos in the photo caption. In past years, I’ve used online tools for this purpose, which is very user friendly, but I miss the ability to fine control the dimension of the grid.
For last year’s retrospective, I decided to explore doing this myself in Python, and this post documents the process.
The general idea is for users to setup a folder with multiple images, then choose the collage dimensions (including width, number of columns and rows). By using a Jupyter notebook the collage is generated inline so it’s easy to download.
Image Processing
Digression: The process of finding a library
I thought of using scikit-image for this, since it looks like a well-estabilished project, but it turns out it doesn’t provide good API for simpler tasks like resizing images or getting image metadata (Exif), so I ended up choosing Pillow.
The process of finding the right tool for the job is a bit frustrating but also interesting. You start with some Google searches, e.g. “Image processing Python library”, but that takes you to a sub-optimal direction, suggesting scikit-image and then by asking more specific questions such as “How to extract image metadata in scikit-image” you often find Stack Overflow answers mentioning this other library Pillow.
I tend to avoid high level libraries for narrow use cases and prefer to stick with lower level ones in hopes they cover a bigger range of use cases so that learning them is more useful long term (this worked well with Matplotlib for example). The struggle with scikit-image APIs tilted the balance and made me pick Pillow.
Size normalization
One constraint for the collage is that all images have to have the same dimensions, so scaling is needed. For the collage I also restricted images to have the same orientation, landscape.
Still, images might have slighlty different aspect ratios so we can’t just scale and keep the aspect ratio, we need to crop as well. To avoid need of intervention, we either take the aspect ratio as parameter of pick the one from the first image. Then we crop the margins of the others to match.
The algorithm is simple. First we compute the collage height (the free variable) from the aspect_ratio and collage_width (in pixels):
collage_height = collage_width / aspect_ratioThen we compute the desired image size in pixels too. Parameters cell_space is the distance in pixels between two cells:
ideal_image_width = (collage_width - cell_space * (col_cnt - 1)) // col_cnt
ideal_image_height = (collage_height - cell_space * (row_cnt - 1)) // row_cnt
We then compute the ratio between an image dimensions and the desired ones. We pick the minimum ratio and then scale the image accordingly. By scaling via the minimum instead of maximum factor, one of the dimensions will exceed the ideal dimension, but we’ll adjust by cropping it later. Variable image below is a Pillow object representing one of the images:
factor = min(
    image.height / ideal_image_height,
    image.width / ideal_image_width
)
image = image.resize(
    image.width // factor, image.height // factor,
)
We assume the center of the image contains the more useful information, so we minimize loss of central information by cropping from the borders equally:
height_slack = image.height - final_image_height
offset_top = height_slack / 2.0
width_slack = image.width - final_image_width
offset_left = width_slack / 2.0

image = image.crop((
    offset_left,
    offset_top,
    offset_left + final_image_width,
    offset_top + final_image_height
))
At this point we should have all the images with the same size.
Orientation
Once I rendered this result I noticed some images were upside down. Turns out I took the landscape photos using different rotations of the iPhone and the images are stored as is, but never noticed this because UIs like MacOS’s Preview and Google Photos rotate them properly by using the Exif metadata.
In the folloing code ExifTags.TAGS is a dictionary mapping readable tag names to tag IDs. We look for the one called 'Orientation' and check the corresponding value in the image’s exif. It looks like it indicates the number of 90° rotations, 0 being the phone upright position. Since we’re assuming landscape images, we only need to deal the case with 270° rotation, thus code 3:
from PIL import ExifTags

def get_orientation_key():
    for orientation in ExifTags.TAGS.keys():
        if ExifTags.TAGS[orientation] == 'Orientation':
            return orientation

exif = image._getexif()
orientation_key = get_orientation_key()
if orientation_key in exif:
    if exif[orientation_key] == 3:
        image = image.rotate(180)
Display
I’ve used Matplotlib’s grid plot many times in the past and thought it could be used for the collage as well. There are few wrinkles that needed to be addressed however.
Issue 1: Inches vs. Pixels
The first issue is that the dimensions of chart are to be given in inches instead of pixels.
To convert pixels to inches we need to find the PPI (pixel per inch) of the current display. The monitor I tested on is 30” and the resolution is $2560 \times 1600$. The diagonal is thus $3018.87$ and the PPI can be obtained by dividing the diagonals, so it’s $100.63$.
It seems like a rule of thumb is to assume 96 PPI for monitors, but laptops often have higher PPI (e.g. MacBook Pro has 254).
from math import hypot
physical_diagonal_in = 30
res_diagonal_px = hypot(2560, 1600)
ppi = res_diagonal_px / physical_diagonal_in

fig, axs = plt.subplots(
    nrows,
    ncols,
    figsize=(collage_width / ppi, collage_height / ppi),
)
It seems that there’s a related concept called DPI (dots per inch) which is often conflated with PPI, including Matplotlib’s API which takes a parameter called dpi.
I thought hacking the API to assume the dimension of an inch is collage_width would avoid explicit PPI calculation, but this didn’t quite work:
fig, axs = plt.subplots(
    nrows,
    ncols,
    figsize=(1, collage_height / collage_width),
    dpi=collage_width
)
The size seems correct but it added huge margins.
Issue 2: Cell Spacing
plt.subplots() supports configuring the cell spacing via the fields wspace and hspace in the gridspec_kw param. They’re to be given as percentage of the size, not in pixels, not in inches.
cell_space = 20
gridspec_kw = {
    'wspace': cell_space / collage_width,
    'hspace': cell_space / collage_height,
}
fig, axs = plt.subplots(
    nrows,
    ncols,
    figsize=(collage_width / ppi, collage_height / ppi),
    gridspec_kw=gridspec_kw
)
Issue 3: Inconsistent Return Shape
If either nrows or ncols is 1, plt.subplots() will return a scalar instead of a matrix with one element. That means this code:
plt.subplots(nrows=1, ncols=1)returns a scalar AxesSubplot, not [[AxesSubplot]] as one would expect, and similarly both calls:
plt.subplots(nrows=2, ncols=1)
plt.subplots(nrows=1, ncols=2)
return the same shape [AxesSubplot, AxesSubplot] instead of [[AxesSubplot], [AxesSubplot]] and [[AxesSubplot, AxesSubplot]], respectively. This “magic” behavior is one of the things I really dislike about R and it’s sad to see it in Matplotlib.
This is particularly annoying for our case since nrows and ncols are parameters in our notebook, so we have to normalize the result:
if nrows == 1:
    axs = [axs]
if ncols == 1:
    for i in range(nrows):
        axs[i] = [axs[i]]
Rendering
With the wrinkles ironed out, rendering the grid is quite simple. We just turn off the axis since we’re not rendering a chart:
for r in range(nrows):
    for c in range(ncols):
        ax = axs[r][c]
        ax.imshow(thumb_images[r*ncols + c])
        ax.axis('off')
The notebook is available on Github.
Results
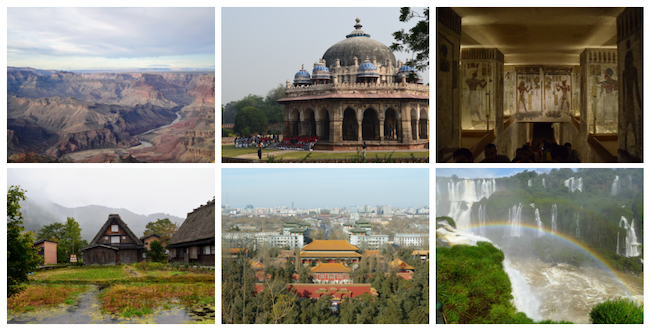
I was very pleased with the results. The image at the beginning of the post is a collage from photos I think haven’t been included in previous retros and was generated using this notebook.
I thought the savings from this automation would be marginal since I’d only use this once a year, but turns out this is also helpful for other cases too, like showing comparison charts side by side like in the post [Paper] Watermaks in Stream Processing. In the past I would do some hacky manipulation using MacOS’s preview to put two images together.
Further Improvements
I could automate this process further. One idea is that instead of setting up the photos in a local folder I could simply add the URL to the corresponding Google Photos plus some description. The script would download them, make the collage and then generate the markdown snippet with the caption and links.
One extension is to instead of cropping, we pad the images to adjust the aspect ratio. I don’t think it would look good on photos but is probably more desirable for charts, where cropping could end up removing axis for example.
Conclusion
This has been a good learning experience. I’ve spend a couple of hours to get to a working solution and a few more to write this post.
Hopefully knowing about Pillow’s capabilities will make me more aware of opportunities to automate some of my occasional image processing needs.
