kuniga.me > NP-Incompleteness > [Book] BPF Performance Tools
[Book] BPF Performance Tools
28 Dec 2025
In this post I’ll share my notes on the book BPF Performance Tools: Linux System and Application Observability by Brendan Gregg.
This book covers a Linux kernel functionality called BPF, which stands for Berkeley Packet Filter. It was originally developed for network packet analysis (hence the name), but it has been extended as a general mechanism for running user code inside the kernel in a safe virtual machine.
One of its applications is to collect metrics and do event tracing in real-time, being a very powerful tool for performance analysis.
Book Summary
The book covers BPF and tools built on top of it such as BCC and bpftrace. It then shows how to use them for performance analysis of CPU, memory, disk and network.
The book has about 740 pages, divided in 18 chapters. I skipped most of the code snippets but otherwise read the book end-to-end.
Chapter 1 and 2 provide an overview of BPF and related tools and concepts. Chapter 3 provides a summary of performance analysis, including methodology. This is covered in more depth in Gregg’s other book, Systems Performance.
Chapter 4 covers BCC and Chapter 5 bpftrace. Like in the Systems Performance book, Chapters 6 to 10 cover performance analysis of CPU, Memory, Filesystem, Disk I/O and Network, respectively. In this book however, it uses BCC and bpftrace as the tools.
Chapter 11 covers security (not the safety of BPF) but doing security analysis to detect suspicious activity. Chapter 12 covers how to use BPF tools for different languages (compiled, JVM, interpreted).
Chapter 13 shows how to analyze at the application level, using MySQL as an example. Chapter 14 focuses on kernel tracing, but it overlaps quite a bit with Chapters 6 to 10.
Chapters 15 and 16 focus on the cloud: containers and hypervisors. Chapters 17 discusses other BPF tools besides BCC and bpftrace and finally Chapters 18 provides some practial tips and tricks when using BPF.
I was mostly interested in learning about BPF and bpftrace in general, and their application to CPU and memory, so my notes are mostly from Chapters 1, 2, 5, 6, 7 and 13.
Terminology
There are a lot of terms and concepts and they can be confusing. In this section I compare terminology that are closely related.
BPF, BCC and bpftrace
These are related concepts but are at different levels of abstraction. BPF is the lowest-level and can be seen as the virtual machine that executes bytecode instructions.
BCC (BPF Compiler Collection) is a bit confusing because it provides both high-level APIs, such as in Python and Lua, that gets translated into bytecode that BPF can run, but it also provides a bunch of ready-to-use scripts (the book covers many of them). So in comparison with BPF and bpftrace it can be seen as a high programming language.
bpftrace is a DSL that allows for more concise programs than BCC but is less expressive.
kprobes, uprobes, tracepoints and USDT
kprobes and uprobes are called dynamic probes that can be inserted into the kernel or user binary without recompiling it. The prefixes k- and u- stand for kernel and user space respectively.
They are independent from BPF but are supported by it. For example, we can use bpftrace to attach a kprobe in the kernel functions called tcp_sendmsg(), intercept its second argument and accumulate it until we stop.
$ sudo bpftrace -e 'kprobe:tcp_sendmsg { @bytes = sum(arg2); }'
Ctrlttached 1 probe
^C
@bytes: 270337
If the function is running in a user defined binary, we would attach a uprobe.
There’s also the static version of these, called tracepoint for the kernel and USDT (user-level statically defined tracing) for user. In this case they need to be specified in code, upfront.
The advantage of static trace points is that their name are more stable and can have more documentation. The kernel has a bunch of tracepoints such as tracepoint:syscalls:sys_enter_open which corresponds to the open(2) system call.
Summary table:
| Dynamic | Static | |
|---|---|---|
| Kernel | kprobe | Tracepoint |
| User | uprobe | USDT |
BCC
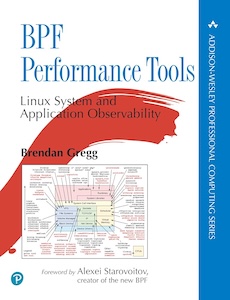
The book doesn’t go much into details on writing BCC scripts, but rather the scripts that are included with BCC. In fact, the diagram in cover of the book depicts the universe of such scripts and what part of the stack they cover.
bpftrace
My main interest in bpftrace is the syntax and the set of features it provides. My understanding is that we declare conditions (called probes in bpftrace) + filters and callbacks (actions).
The program runs indefinitely and continuously process each task handled by the kernel (i.e. thread) and for each thread that matches the probe, the action fires.
We can either run a bpftrace script inline like above:
bpftrace -e 'kprobe:tcp_sendmsg { @bytes = sum(arg2); }'Or we can write the code into a file:
// my_script.bt
kprobe:tcp_sendmsg {
    @bytes = sum(arg2);
}
and run
bpftrace my_script.btProbes
Multiple Probes. We can specify multiple probes that execute the same action
probe1, probe2 {
    actions
}
which should be equivalent to
probe1 {
    actions
}
probe2 {
    actions
}
Wildcard probes. Example:
kprobe:vfs_* {
    actions
}
Matches all probes beginning with kprobe:vfs_. To see the actual list one can run:
bpftrace -l 'kprobe:vfs_*'By default, there’s the wildcard truncates to 512 probes, which is configurable via the environment variable BPFTRACE_MAX_PROBES.
Actions
Multiple Actions. Are separated by a semi-colon:
probe {
    action1;
    action2;
}
The ; in the final action is allowed but optional.
Filter
The syntax for filters is that it follows the probe declaration:
probe / filter / {
    actions
}
Example: print a string whenever bash opens a file.
kprobe:sys_openat / comm == "bash" / {
  printf("bash opened a file\n");
}
comm is a special variable corresponding to the process name (see built-in variables below).
Comments
Comments use C/C++ syntax for single and multi-line.
BEGIN/END
We can have more imperative-looking code with the BEGIN block which executes once, when the program starts and END, executed at the program’s end.
// my_script.bt

BEGIN {
    print("Starting\n");
}

END {
  printf("Ending\n");
}

kprobe:tcp_sendmsg {
    @bytes = sum(arg2);
}
Note that the declaration order of the “blocks” doesn’t matter.
Variables
Built-in. these are defined by the system and have special behavior:
comm- as we’ve seen, this stores the name of the process being evaluatedcurtask- the address of the current thread’stask_struct, which is a kernel struct with metadata for the current thread (task in kernel lingo).nsecs- current timestamp in nanosecondspid- the PID of the process being evaluated.tid- the ID of the current thread
Scratch. these are the typical variable you might think of:
probe {
    $x = 1;
    $y = "hello";
}
They’re prefixed with $ and do not require explicit typing and are only visible within the action block in which they’re assigned.
Map. variables are prefixed with @ and differently from scratch variable, they’re visible across all actions, so can be used to pass information across them:
probe1 {
    @a = 1;
}
probe2 {
    $x = @a;
}
If “probe1” fires before “probe2”, $x will be assigned 1. Otherwise map variables are initialized with 0, so $x will be assigned 0.
More fittingly to the name, map variables can be used as a hashtable:
probe1 {
    @start[tid] = nsecs;
}
probe2 {
    $d = nsecs - @start[tid];
    print("time between p1 and p2: %dns\n", $d);
}
The map can be multi-dimensional, e.g. $path[pid, $fd]. To visualize the contents of a map, we can do print(@x), however the contents of maps are printed to the console once pfbtrace finishes.
Built-in Functions
printf(). Much like in C:
BEGIN {
    print("Starting\n");
}count(). This function returns a variable of special type count, which can be assigned to a map. The behavior is that it increments a counter every time the action runs.
probe1 {
    @x = count();
}
This can be used with a key to do a breakdown, e.g. count per process name:
probe1 {
    @x[comm] = count();
}
sum(). This function is analogous to count, but you pass an argument to add to an existing sum.
kprobe:sys_write {
    @bytes = sum(arg2);
}
In this example @bytes has the sum of all bytes written by sys_write(). It also works with a key. A similar function exists for average, avg().
hist(). This function returns a histogram with automatic binning, typicall powers of 2.
kprobe:sys_write {
    @bytes_histo = hist(arg2);
}
This function breaksdown the bytes written by sys_write() into bins.
CPU Tools
In this section I’ll summarize some of the tools/scripts in the BCC repository with a short description of what it does. This corresponds to Chapter 6 of the book where the author makes an interesting observation:
Unfortunately, many top(1) variants focus on visual enhancements rather than performance metrics, making them prettier but unable to shed light on issues beyond the original top.
| Tool | Description | Display |
|---|---|---|
execsnoop |
Show processes that are created | Table with process name, PID, the PID of the parent and the arguments. |
exitsnoop |
Measures the age of a process upon termination | Table with process name, PID, age and exit code |
runqlat |
How long a task (thread) waits on CPU. Indicating saturation. Healthy values are below 1ms | Histogram of task counts by the queue latency in µs. |
runqlen |
Another view of runqlat, measuring queue lengths. Can be broken down by CPUs, so useful to find imbalance |
Histogram of samples by queue size. |
runqslower |
Which processes that stayed in the queue for longer than a threshold (default 10ms) | List of processes and duration |
cpudist |
How long a task stays on CPU. It doesn’t track if a task gets preempted and then goes back to CPU (context switch), so can skew to small values | Histogram by duration in µs |
cpufreq |
Clock frequency by CPU. I don’t know how useful this is in practice but I did not know CPUs changed their frequency dynamically (it’s possible to disable this) | Histogram by frequency |
profile |
Takes snapshots of stacktraces when a task is on CPU and counts how many samples it founds for the same stacktrace. This is the most useful tool for CPU analysis, but it’s only useable if displayed in a flame chart. It’s kind of hard to grok this unless you’ve used this chart before | Histogram by stacktraces. |
offcputime |
Analogous to profile but for when the task is not on CPU |
Histogram by stacktraces. |
syscount |
Count of system calls | Can either be a histogram by syscall name or by process name (how many syscalls each process calls) |
funccount |
Similar to syscount but covers any kernel functions and can be filtered via regex, e.g. funccount 'tcp_*' samples all functions starting with tcp_ |
Histogram by function name |
Both syscount and funccount are very simple to implement in bpftrace. For example funccount 'tcp_*' is equivalent to:
bpftrace -e 'k:tcp_* { @[probe] = count(); }'For profile and offcputime, the stacktrace might be truncated if the libraries the application uses does not enable frame pointers. There’s a registry that is meant to be used to store frame pointers and is needed for stack walking, but some binaries such as libc are compiled to ignore that convention to improve performance slightly by having an extra register available for general purpose. It’s possible to turn off this behavior in GCC with -fno-omit-frame-pointer.
In other chapters some CPU-related bpftrace tools are presented:
| Tool | Description | Display |
|---|---|---|
threaded.bt |
How much time each thread of a process spends on CPU | Snapshot of CPU time per thread, every second. |
Memory Tools
In this section I’ll summarize some of the tools/scripts in the BCC repository with a short description of what it does. This corresponds to Chapter 7.
The out-of-memory process killing is done by the kernel. When it does so it logs data which can be retrieved via dmesg. The autor recommends looking at this before starting memory analysis.
| Tool | Description | Display |
|---|---|---|
oomkill |
Print stats after the process is killed. This command must be running when the process OOMs | List with process names and PIDs and load averages in the last 1, 5 and 15 minutes. |
memleak |
Shows allocations that haven’t been yet de-allocated. It cannot distinguish between memory growth or long term allocation. Can add overhead if there’s a lot of allocations. | Call stacks of top 10 outstanding allocations |
mmapsnoop |
Traces calls to mmap() |
Table showing the process making the mmap() call and also the file name the memory is being mapped to (unclear what it would show for anonymous pages). |
faults |
Tracks when memory was first used (after lazy allocation) and thus mapped to physical memory | Call stacks and frequency count. |
vmscan |
Instruments the page-out daemon (kswapd) to measure how much time is spent on page swaps. |
Table showing times taken for different types of reclaims (kernel cache, foreground reclaim, cgroup reclaim) at every second. It also shows the number of ksawpd wake ups and pages written to disk. On termination histograms are shown for direct and kernel cache reclaims. |
drsnoop |
Similar to vmscan but only for direct reclaims and does the breakdown by process. |
Table including process name, duration and number of pages each time a reclaim happens. |
swapin |
When pages are swapped-in after being swapped out | List of process being swapped in and page count at every second |
File System
In this section I’ll summarize some of the tools/scripts in the BCC repository with a short description of what it does. This corresponds to Chapter 8.
Despite what the name suggests, these tools are used not just for files, but other resources that use file system under the hood via file descriptors, such as sockets.
I’m omitting the Display column on the table listing.
| Tool | Description |
|---|---|
opensnoop |
Shows which files are being opened by each process. One interesting application is to find the location of configuration files used by the program. |
filelife |
This is one of my favorite tool names! It measures the lifespan of a file. Can be used to find small optimizations by detecting short-lived files. |
fsrwstat |
Aggregate counts of reads and writes to different file system types such as sockets, tempfs, pipes, etc. |
fileslower |
Lists writes to files that took more than a threshold (default is 10ms). |
Network
There are lots of tools for network analysis, many around socket and TCP probing.
Application-Level
Chapter 13 describes the analysis of a MySQL database server using some of the tools presented in previous chapters but it includes new ones more specific to this application. A few are MySQL-specific but others are more general to a lot of applications, for example those using the POSIX thread library.
| Tool | Description |
|---|---|
pmlock.bt |
Records stack traces and lock address and for each one displays a histogram of time waiting for the lock. It can be used to find if there’s lock contention. |
pmheld.bt |
Records stack traces and lock address and for each one displays a histogram of time holding the lock. It can be used what is causing the lock contention. |
Conclusion
I really enjoyed this book! I learned a lot about bpftrace and am very excited to put some of this knowledge into practice! I need to do some extra studying to learn what else is available for application level analysis in particular for C++, so hoping to write about this at some point.
There are tons of BCC scripts/tools, but I’m not sure if it’s worth studying or documenting them in the era of ChatGPT. I’ve heard experienced performance folks just ask ChatGPT for bpftrace scripts to do what they need, so it seems more worth knowing the syntax to at least be able to tell if the script is doing what one expects.
