kuniga.me > NP-Incompleteness > Source-Filter Model
Source-Filter Model
03 Apr 2021
Gunnar Fant was a Swedish researcher in speech science. He received his MSc in Electrical Engineering from KHT and worked at Ericsson and MIT. In 1960 he published the source-filter model of speech production, which became widely used [1].
In this post we’ll study the source-filter model as a simplified representation of human speech.
Sound waves
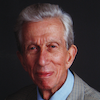
First, let’s revisit the mechanics of sound. Sounds are what our brain perceives when air molecules vibrate inside our ear. More precisely, vitrating air molecules cause the eardrum and bones in the middle ear to also vibrate and these are in turn converted to electric signals by hair cells in the cochlea [2].
In this sense, sound is just our brain interpretation or these vibrating molecules, just how color and pain are brain interpretations. However, sound is often used more generaly to refer to the vibration of molecules and can exist without a brain to interpret it. This will be the definition we’ll work with henceforth.
We often hear (pun intended) about the term sound wave which causes us to conjure images of wavy lines. Vibrating chords are often used as a physical analogy to waves. While useful, these analogies can make understanding the mechanism of sound a bit harder. According to Dan Russell [6]:
Students are generally introduced to the concept of standing waves through a discussion of transverse standing waves on a string. (…) However, sound waves are longitudinal waves and the particle motion associated with a standing sound wave in a pipe is directed along the length of the pipe.
Let’s take a closer look at sound waves represent in reality.
Longitudinal Waves
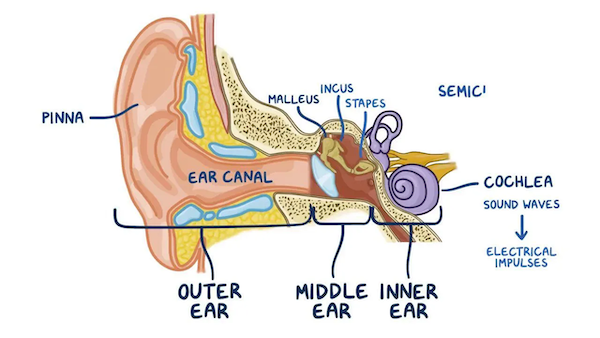
Instead of vibrating chords like that of a guitar, I think a better analogy is the Slinky, the coil-like toy that can be easily compressed and de-compressed.
If we fix one of the ends of a Slinky and compress the other side slightly, the compression travels along the coil. These are known as longitudinal waves [3] and it’s more similar to how sounds work.
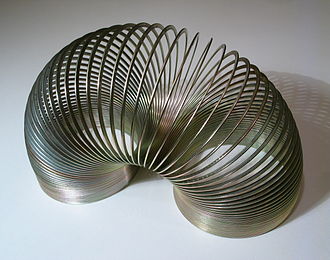
When we beat a drum, its surface vibrates and in the process it dislocates small amounts of air molecules, alternating between pushing a bunch of molecules together which restricted their motion (higher pressure, lower displacement) - and then retreating, leaving more space for the molecules to spread (lower pressure, higher motion).
The wavy chart we often see as representing sounds is a graphical representation of either the pressure or displacement over time at a specific point. Alternatively, the chart might be depicting the pressure / displacement profile along some axis at some given instant of time.
This simulation makes it easier to visualize the relationship between these charts.
It’s more convenient to work with the graphical form when modeling sounds because they’re much simpler, so we’ll primarily work with them from now on but it helps knowing what it’s actually happening behind the scenes to have better intuitions.
Amplitude, Frequency and Wavelength
Suppose we have a periodic source of sound, such that the pressure vs. time graphical representation at a given point is a perfect sine wave. The amplitude is the height of the crest. We can define the pressure at rest to be 0, so a positive amplitude represents increased pressure (compression), and a negative one decreased pressure (rarefaction).
The frequency is how many cycles happen in a period of time (the standard unit is Hertz, representing the number of cycles in a second).
The wavelength is the length of a complete cycle. In sound terms, it could be the physical distance between two adjacent regions of the highest pressure.
The Speed of Sound
Going back to the drum analogy, suppose we have a listener located a few meters away from us. When we beat the drum once, it will take some time before it reaches their ears. The distance between listener and source divided by the time it takes for the sound to be heard defines the speed of sound.
If we visualize the pressure profile along an axis it would look like a pulse:
Suppose we wanted them to listen the beat sooner.
Maybe we can hit the drum harder? This would cause more displacement of the air molecules and hence higher pressure during compression. In graphical terms, it would increase the amplitude, but wouldn’t make the sound travel faster.
Maybe we can hit the drum faster? This would “narrow” the size of the pulse but would not make it travel faster.
We learn in school about the formula:
\[(1) \qquad c = f \lambda\]Where $c$ is the speed of sound, $f$ is the frequency and $\lambda$ is the wavelength. According to the model behind this formula, if temperature, pressure and medium are constant, $c$ is fixed. For example, if we increase the frequency of the sound it will cause the wavelength to decrease accordingly.
I find it a bit counter-intuitive to think there’s no way we can make the sound travel faster. If we were to throw a ball to our listener, throwing it with greater force would make the average speed of the ball to increase.
I don’t have enough understanding of the physics but the formula above arises from a model that is likely making some assumptions, namely that the vibration at the source is small enough for it to only cause “localized changes” in air particles [4].
If we really wanted to use force, we could cause an explosion at the source and this would push the actual air particles at the source towards the listener’s ears instead of the transitive vibrations. This would break the “sound as logitudinal waves” model and (1) would not apply.
Since we’re mostly interested in human speech, we are able to work with this sound model, but it’s worth introspecting what assumptions and simplifications are taking place.
Interference
When two sound waves interfere, their effect is added. It can be a constructive interference if both have the same amplitude signal or a destructive interference otherwise. Destructive interference is used by noise cancelling headphones.
Most sound waves are not perfect sine waves as it’s often depicted, but a more complex shape. But if the sound is (or mostly) periodic, it can actually be decomposed into multiple sine waves (via the Fourier transform) which when added approximate the original signal.
The representation of a periodic signal by its frequencies is very convenient because it requires much less information to be stored. An analogy would be the vector format for images (SVG) which can represent/approximate some classes of images by very few parameters.
Sound in a Tube
Studying sound propagation in a tube is interesting because it allows us to treat it as a one dimensional, which simplify things.
Reflection
Similar to light, sound can be reflected if it encounters a medium with different characteristics. This can be experienced when shouting inside a cave - the sound waves will bound off the walls and travel back to our ears. This phenomenon is also used by sonars for detecting objects under water.
If we send waves from one end of the tube to the other, reflection happens as well. The way it reflects depends on whether the other end of tube is closed or open.
If it’s closed, it’s similar to sound hitting a wall. The displacement of air molecules will tend to zero at the wall since it cannot push the solid’s molecules. Due to conservation of energy, the molecules will bounce back once they hit the wall, creating the reflected wave.
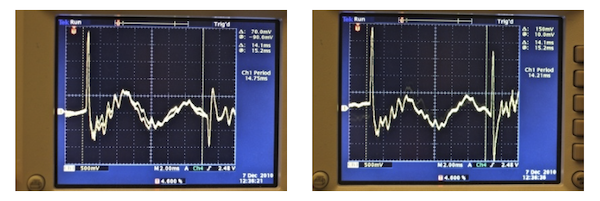
If it’s opened, I honestly don’t have a good intuition and haven’t found a good explanation online. In [5] however, it’s demonstrated empirically that such reflection happens. The authors also make the following comment:
It’s difficult for students to conceptualize the nature of reflections from closed and open pipes—especially open pipes. “How can the sound reflect off something that isn’t there?”
It should be possible to explain this behavior mathematically via fluid dynamics by assuming the conservation of energy [7] but I haven’t dug into that.
Regardless of the exact mechanism that causes reflection in an open tube to happen let’s consider the pressure at such point. Because the outside of the tube is so vast, it’s impossible for the air molecules to exert any pressure changes on it, so if we look at the pressure profile along the tube, it has to be at 0 (that is, the base pressure) at the end.
Summarizing, in an open tube the pressure is 0, while in a closed tube the displacement is 0.
Resonant Frequency
Reflection is an important component to consider because the reflected wave will interfere with the original wave. Depending on the “aligment” between these waves they can result in different effective waves.
If the alignment is right, the resulting wave will have maximum amplitude. The alignment can be controlled by changing the frequency, which in turn affects the wavelength. Frequencies for which the alignment yields maximum amplitude are called resonant frequencies.
A tube can act as a frequency filter. If we send sound waves composed of multiple primordial frequencies, the ones closer to the resonant frequencies will get amplified, effectively filtering out the other frequencies. This is the filter component of the source-filter model we’ll talk about at the end.
Example: The Clarinet
A real-world example that is very close to the tube model is the clarinet (check this interesting introduction from Philharmonia Orchestra).
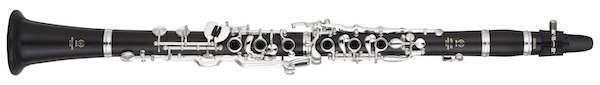
It is a musical instrument which can be modeled as a tube, open at one end and closed on the other.
The vibration is created at the one end of the tube by blowing air through the wooden piece called the reed.
The holes along its body cause air to escape, changing the resonance frequency and allowing the musician to produce different frequencies (pitch).
Speech Representation
First, let’s introduce some terminology from phonetics.
Phonetics
The phoneme is the unit of speech [9] and a word consists of multiple of them. They can represented in written form using IPA (International Phonetic Alphabet), which is a notation based on the Latin alphabet to represent phonemes in written form. It’s written between /, for example /fəʊ̯n/ representing the pronounciation of “phone”.
Multiple letters can map to the same phoneme and the same letter can map to different phonemes in different words. As an example of the latter, in car, the a has the phoneme /ɑ/, while in bat it is /æ/.
The Human Vocal Tract
The way humans produce voiced sounds is by exhaling air from the lungs, which then passes through the vocal cords in the larynx which cause it to vibrate, in much the same way the reed vibrates in a clarinet.
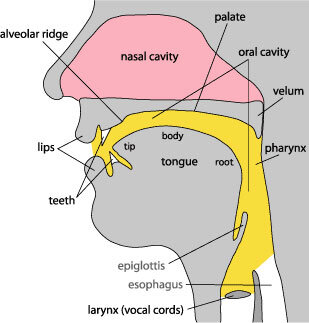
We then have ways to transform that source signal by changing the resonating frequency of the vocal tract, via the articulators [9]: lips, tongue, muscles in the pharynx and the soft palate (which controls the airflow to the nasal cavity). Pure voiced sounds correspond to the pronounciation of vowels.
Humans can also produce noise sounds where the vibration does not originate at the vocal chords and correspond to the pronounciation of consontants. They can be categorized in different types depending on how they’re produced.
Plosives are noise sounds created from a sudden release of air, like when pronouncing /b/ or /p/ (mnemonic: explosive). Plosives can be further categorized into bilabial (lips), alveolar (tongue) and velar. Each of these can be combined with voiced sounds. Here’s a full list [11]:
| bilabial | alveolar | palato-alveolar | |
|---|---|---|---|
| voiceless | /p/ | /t/ | /k/ (cat) |
| voiced | /b/ | /d/ | /g/ (goat) |
Fricatives are noise sounds produced by blowing air through almost closed lips or teeth to pronounce phonemes like /f/ and /s/ (mnemonic: friction). Fricatives can be further categorized into labiodental (lips + teeth), dental, alveolar, palato-alveolar and glottal.
It’s also possible to have a combination of voiced and noise sounds, known as voiced fricatives. Here’s a full list [11]:
| labiodental | dental | alveolar | palato-alveolar | glottal | |
|---|---|---|---|---|---|
| voiceless | /f/ | /θ/ (thick) |
/s/ | /ʃ/ (show) |
/h/ (hat) |
| voiced | /v/ | /ð/ (there) |
/z/ | /ʒ/ (pleasure) |
Affricates are plosives followed by fricatives.
| palato-alveolar | |
|---|---|
| voiceless | /ʧ/ (change) |
| voiced | /dʒ/ (job) |
Nasal sounds are created when air escapes through the nose, causing the vibration to happen there. There are 3 types of nasal sounds:
| bilabial | alveolar | velar |
|---|---|---|
| /m/ | /n/ | /ŋ/ (sing) |
Approximants are noise that sound in some ways like a vowel. A lateral approximant is when the air escapes through the side of the tongue, such as /l/ (like). The phonemes /r/ (right), /j/ (yes), /w/ (wet) are other examples.
The Source-Filter Model
Having seen all this theory, using the tube model to represent speech seems a natural thought. The vibrating vocal chords acts as the source and the controls on the vocal tract change the resonance and act as filters.
The video below makes it more palpable.
It contains a generator of a periodic signal with frequency 130 Hz acting as the source and then different casts modeling the sounds /a/ and /o/ are connected to it.
The simple version of the model consists of just two parameters: the source frequency and the resonance frequency of the tube / filter.
To model speech, we use one or more tubes for each phoneme. Voiced noises require at least two tubes, one for the voiced sound and another for the noise sound. The pronounciation of a sentence will thus be composed of multiple tubes over time.
The computational problem associated with a source-filter model is to determine these parameters from data.
This model can be used for example to efficiently encode voice. In [8] (see Analysis/Resynthesis) Hyung-Suk Kim is able to achieve 15x compression of speech while mostly preserving the original pitch.
Conclusion
I love inter-disciplinary studies like these. In here we covered subjects from math, physics, biology and linguistics!
Even though I had learned about sound waves in high school, I realized I still had a lot to learn while writing this post. I think there are primarily 3 reasons:
- The internet - there’s so much content freely available in the internet, including videos and animations. Back then I only had the books and teachers as resources.
- Intellectual curiosity - it’s one thing to be passively taught a subject in high school as opposed to genuine personal curiosity in trying to understand things much more deeply.
- Knowledge - since high-school I learned subjects like calculus, numeric methods, fluid dynamics (sort of) and programming. Some are directly related but others help with analogies or different ways of thinking.
References
- [1] Wikipedia - Gunnar Fant
- [2] Hearing Health Foundation - How Hearing Works
- [3] The Physics Classroom - Sound as a Longitudinal Wave
- [4] The Feynman Lectures on Physics: Sound. The wave equation
- [5] Sound Reflections in Pipes
- [6] Acoustics and Vibration Animations: Standing Sound Waves (Longitudinal Standing Waves)
- [7] An Introduction to Acoustics - S. W. Rienstra and A. Hirschberg
- [8] Linear Predictive Coding is All-Pole Resonance Modeling - H. Kim
- [9] Wikipedia - Phonetics
- [10] - Linguistics Phonetics - The source filter-model of Speech Production
- [11] English Phonetics and Phonology - F. Trujillo
