kuniga.me > NP-Incompleteness > HyperLogLog in Rust
HyperLogLog in Rust
01 Apr 2018
In this post we’ll study the hyper log log algorithm and provide an implementation in Rust.
Introduction

Philippe Flajolet was a French computer scientist at INRIA [5]. He introduced the field of Analytic Combinatorics and is known for the creation of a family of algorithms of probabilistic counting, including the HyperLogLog.
HyperLogLog is a probabilistic algorithm to determine the number of distinct elements (or cardinality) from a multi-set (a set that allows repeated values) with high accuracy using very low memory. It is then suitable for streaming applications or distributed databases in which we do not have the luxury of keeping all distinct values in memory at any time.
The HyperLogLog
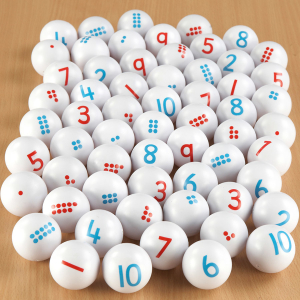
The intuition behind the HyperLogLog is the following. Imagine we have a basket full of balls, each containing a number, which can be repeated. We want to estimate how many distinct numbers we see in the basket with the limitation that we can only look at one ball at a time and we do not have paper and pen, so we have to rely on memory.
The number of balls in the basket can be very large, so it’s unrealistic to keep track of all possible values we see, and we need a proxy to estimate the number of distinct values. The trick is to find some property that only very rare numbers satisfy, and the intuition is that if such property was satisfied by any of the numbers we saw, then there’s a good chance we saw a lot of numbers (or we’re very lucky).
To start, say that the property is “multiple of 2”. That is not a rare property, so if we assume the numbers in the balls do not have any special pattern, on average, we just need to find 2 different numbers to see that property being satisfied. Now say the property is “multiple of 4”. Less numbers satisfy this property, so the average number of distinct values we need to look at would be 4. We can keep going on for higher and higher powers of 2, and the average number of distinct values we look at would need to be as big.
This means that if we keep track of the largest power of 2 that divides any number we drew, we could estimate that that was the number of distinct values! The power of 2 property is interesting because it doesn’t change if there are duplicated values (which is great because we only want distinct values) and it doesn’t rely on the magnitude of the values as long as the set of values are uniformly distributed.
This estimate is not great though because the error is proportional to the number of distinct values found. For example, if we found out that the largest power of 2 divider was 2048 (2^11), the actual number of distinct values could be between 2048 and 4095 (2^12 - 1). Also, we could get unlucky and have all the balls in basket be have a single number, say 1024, so the estimate would be off by a lot.
Averaging
To reduce the chances of drawing a ball with a value that turns out to be a large power of 2 and throwing off the estimates, we divide the balls into m groups. The important property of the groups is that balls with the same values should go to the same group and the distribution should be uniform.
We can then find the largest power of 2 divider for each group and average them out. This would help in the case where we saw a single number 1024, because while one group would estimate it to be 1024, all the other groups would be find that the largest divisor was 1 (empty group).
To assign each number to a group, we could use modular arithmetic. For example, if we had 12 groups, we use the remainder of a number by 12 as an index to the group. The problem is that the elements assigned to a given group have a property that will bias the result. For example, for the group corresponding to the reminder 0, all numbers in there are obviously a multiple of 12 and hence 2^2. To make the numbers in the group unbiased, we need to discard the information used to assign them to groups. An easy way to achieve that is to represent each number as binary, use the first bits to decide which group to assign it to, and then discard those bits when computing the power of 2.
We can see that we can increase the number of groups to reduce errors but the tradeoff is that it requires to keep more information in memory. This is the idea first proposed by [2] and was called stochastic averaging.
Harmonic Mean
The HyperLogLog algorithm uses a different combination of the powers of two to obtain a better estimate than using averages: the harmonic mean [1]. To recall, the harmonic mean consists in averaging the reverse of the elements and then reversing the result. For example, the harmonic mean of 1, 4 and 4 is
\[\left( \frac{1^{-1} + 4^{-1} + 4^{-1}}{3} \right)^{-1} = \frac{3}{\frac{1}{1} + \frac{1}{4} + \frac{1}{4}} = 2\]The bulk of the HyperLogLog paper [1] is actually proving that this metric yields an estimate with smaller errors than a simple average.
Hashing
Not all real world input will be numbers that are distributed uniformly. For example, we might be interested in counting the number of distinct values of a string column in a database. We then need to transform these values using a hash function which maps these inputs to numbers uniformly.
Algorithm
We are now ready to outline the core of the algorithm to estimate the cardinality of a multi-set of values.
Given a stream of n elements:
- For each element
- Hash it
- Use the first bits of the hash to determine to which group
jto assign it to - Discard those bits
- Keep track of the largest power of 2 that divides some value in the group, and store the exponent in
M[j]Finally, estimate the number of distinct values based on a harmonic mean of the values inM.
The Expected Value and the Alpha Correction
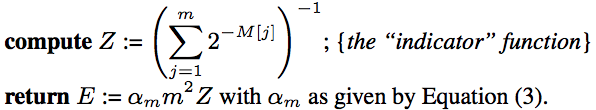
The expectation of the number of distinct values is given by [1]:
\[E = \frac{\alpha_m m^2}{\sum_{j=1}^{m} 2^{-M^{(j)}}}, \qquad \mbox{with} \quad \alpha_m = \left( m \int_{0}^{\infty} \left(\log_2 \left(\frac{2+u}{1+u}\right)\right)^m du \right)^{-1}\]E is equivalent to the harmonic mean times \(\alpha_m m\), and the constant \(\alpha_m\) is a constant to correct some bias. For implementation purposes, the authors provide approximations to this constant:
Small and Big Range Corrections
When the estimated number of distinct elements is relatively small compared to the number of groups m, the author propose a correction.
Let \(V\) be the number of groups to which no element was assigned to. If \(V > 0\), then experiments show that for \(E \le \frac{5}{2} m\), we can change the estimate to
\[E = m \log(m/V)\]Conversely, if the number of distinct elements is very high, closer to 2^32, then the probability of hash collision are very high. The correction accounts for that:
\[E^{*} = 2^{32} \log(E/2^{32} - 1)\]Implementation in Rust
We’ll now present an implementation using Rust. The first part of the algorithm consists in computing M, which we name more clearly as first_non_zero_by_bucket. The following code implements the pseudo-code described above:
let m: u32 = 1 << b;
let mut first_non_zero_by_bucket: Vec<u32> = vec![0 as u32; m as usize];

for element in elements {
    let hash_value = hash(&element);

    // Extracts the first b bits from hash_value to determine the bucket
    let bucket_index: usize = (hash_value & first_b_bits_mask) as usize;
    // Finds the position of the first 1 bit in the remaining bits
    let mut first_non_zero: u32 = first_non_zero_bit_position(hash_value >> b);

    first_non_zero_by_bucket[bucket_index] = cmp::max(
        first_non_zero_by_bucket[bucket_index],
        first_non_zero
    );
}
We don’t need to know much Rust to read the code above. It’s worth mentioning that Rust is very strict about types, so we need to perform explicit conversions.
We use 2 bit operations: one is to obtain the least significant k bits of an integer by using a bit mask. It relies on the fact that (2^k)-1 is a number with k bits 1 and doing a bitwise AND with any number has the effect of only extracting the first k bits of that number. The other trick is to divide a number by 2^k, which can be done by shifting the bits to the right, via the >> operator.
The hash function we use here is from the package farmhash, which is a Rust implementation of Google’s Farmhash, which in turn is a variant of Murmurhash [6]. It basically takes a string and shuffles its bits in a hopefully uniform way, generating a 32-bit integer:
fn hash(value: &String) -> u32 {
    farmhash::hash32(&value.as_bytes())
}
first_non_zero_bit_position() is given by:
fn first_non_zero_bit_position(input: u32) -> u32 {
    let mut remaining: u32 = input;
    let mut first_non_zero: u32 = 1;
    while (remaining & 1) == 0 && remaining > 1 {
        remaining /= 2;
        first_non_zero += 1;
    }
    first_non_zero
}
The formula to obtain the expected number of distinct values is given by
The code below implements this function:
let alpha: f64 = match b {
    4 => 0.673,
    5 => 0.697,
    6 => 0.709,
    // b >= 7
    _ => 0.7213/(1.0 + 1.079/(m as f64))
};

let mut indicator: f64 = 0.0;
let base: f64 = 2.0;
for first_non_zero in &first_non_zero_by_experiment {
    indicator += base.powf(-(*first_non_zero as f64));
}
let m_multiplier = m as f64;
let mut estimate: f64 = (m_multiplier * m_multiplier * alpha) / indicator;
The values of alpha were discussed in the The Expected Value and the Alpha Correction above.
The correction for small and large ranges can be implemented as:
const LARGE_ESTIMATE_THRESHOLD: f64 = 143165576.53333333;
const TWO_TO_32: f64 = 4294967296.0; // 2^32

if estimate <= 2.5 * m_multiplier {
    // Small range correction
    let mut buckets_with_zero = 0;
    for first_non_zero in first_non_zero_by_experiment {
        if first_non_zero == 0 {
            buckets_with_zero += 1;
        }
    }
    if buckets_with_zero > 0 {
        estimate = m_multiplier * (m_multiplier / (buckets_with_zero as f64)).ln();
    }
} else if estimate > LARGE_ESTIMATE_THRESHOLD {
    // Large range correction
    estimate = -TWO_TO_32 * (1.0 - estimate/TWO_TO_32).ln();
}
The complete code is available on Github.
Experiments
For values of b ranging from 4 to 16, I ran the program 100 times for n=100k, with numbers randomly selected from 1 to 100k. Then I plotted the results using the box plot chart using a R script:
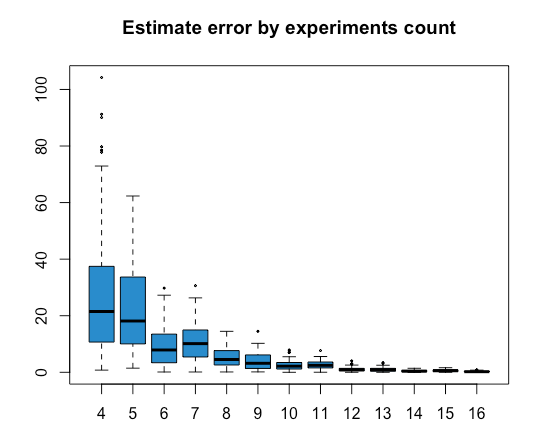
In the chart above, the x-axis represents the number of experiments we divided the input into, and the y-axis represents the relative error compared to the actual value. We can see that as we increase the number of experiments, the errors go down.
This chart was also helpful in finding a bug in my implementation: the initial plot had a sudden spike for values larger than 11, which was when the small range correction applied. After some debugging, I realized that algorithm should you the natural logarithm, not log2. It was great to spot the bug via data visualization!
Conclusion
I’ve been wanting to study the HyperLogLog algorithm for a while, and also one of my resolutions for this year is to learn Rust. It was a productive exercise to implement it.
I’ll post some future impression on Rust from someone with experience in C++ in a future post.
References
- [1] HyperLogLog: the analysis of a near-optimal cardinality estimation algorithm
- [2] Probabilistic Counting Algorithms for Database Applications
- [3] Thu Trang Pham - Curiosity #2: How does Prestodb implement approx_distinct?
- [4] Probabilistic Data Structures for Web Analytics and Data Mining
- [5] Gödel’s Lost Letter and P=NP: Philippe Flajolet 1948–2011
- [6] GitHub: seiflotfy/rust-farmhash
